Generalising function plots to topological spaces
How could we plot a function \(f: X \to Y\) for two general topological spaces \(X,Y\)? Firstly, let’s look at some examples of plots of functions that we are used to.
Example: The plot of \(f: \mathbb{R} \to \mathbb{R}\), \(f(x) := x^2\) is usually the set of points \(\{(x, x^2) \,\vert\, x \in \mathbb{R} \} \subset \mathbb{R}^2\)
Example: The plot of \(f: \mathbb{R^2} \to \mathbb{R}\) is usually the points \(\{(x, y, f(x,y))\} \subset \mathbb{R}^3\)
Inspired by the above, given a function \(f: X \to Y\), we first extend \(f\) to \(g: X \to X \times Y\) by \(g(x) := (x, f(x))\) and we define the plot of \(f\) as the image of \(g\).
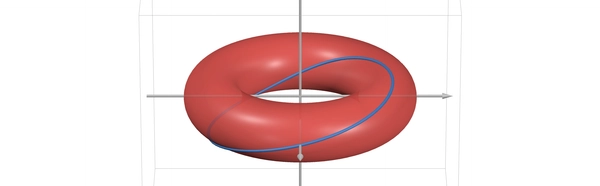
Example: The plot of the identity map \(f: S^1 \to S^1\) is the set of points \(\{(x,x) \, \vert \, x \in \mathbb{S^1}\} \subset S^1 \times S^1 \cong \text{the torus}\)
Choosing some parametrisation we could represent the plot as the blue curve on the red torus.
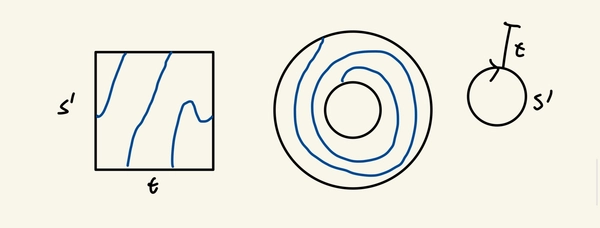
Example: A path on \(\mathbb{S}^1\) is a continuous function \(f: [0,1] \to S^1\) which plot is the set of points \(\{(t, f(t))\, \vert \, t \in [0,1]\} \subset [0,1] \times S^1\)
One could think of \([0,1] \times S^1\) as a square with the two horizontal lines identified or as the annulus which leads to the following pictures.
Personaly, I think this is a somewhat helpful tool at gaining intuition about whether two functions are homotopic.